
Share your experience with the founderhere!

Nishil Patel
Feb 4, 2026
7 min read
Last Updated Apr 7, 2026
Check out the steps to integrate BetterBugs MCP with VS Code in this article. We’ve also included a breakdown of how BetterBugs MCP helps with your AI debugging sessions and some key use cases for it.
1.
Introduction
2.
What is BetterBugs MCP?
3.
How BetterBugs MCP + VS Code Works for AI Debugging Sessions: With Example Use Cases
4.
How to Use BetterBugs MCP with VS Code Agent Mode? Step-by-Step
5.
FAQs
In this article, we’ve covered practical steps to integrate and use BetterBugs MCP with VS Code. We’ve also explained how BetterBugs MCP can help for accurate AI debugging sessions and example use cases for it when you use it with VS code or any other MCP clients, such as Cursor, Claude, and Windsurf.
Also Read: How to Use BetterBugs MCP with Cursor for AI Debugging: Step-by-Step
The BetterBugs MCP (Model Context Protocol) server enables programmatic access to BetterBugs report data for MCP-compatible clients like Cursor, VS Code, and Windsurf. This integration allows AI agents to ingest structured bug telemetry via a report URL. This completely eliminates the need for manual data entry or context switching during the debugging life cycle.
Here’s a quick breakdown of how BetterBugs MCP works with your preferred AI client app:
Register the BetterBugs MCP server within your client's configuration file (e.g., mcp-config.json).
Provide the AI agent with a BetterBugs report link. The agent uses the MCP interface to fetch the report’s underlying JSON payload.
The agent parses comprehensive technical metadata (facilitated through report link), including:
Using BetterBugs MCP, you can share an LLM with the full technical context (Logs + Network + System Info) rather than just a description, the agent can perform more accurate Root Cause Analysis (RCA). This reduces the debugging loop by allowing the AI to propose specific code patches based on real-time runtime data rather than general heuristics.
Also Read: Practical Steps to Use BetterBugs MCP with Claude App for AI Debugging
When you connect BetterBugs to VS Code using MCP, you do not need to copy paste debugging info manually. BetterBugs does this heavy lifting for you and the AI agent can access the complete details using the BetterBugs report link. Let’s drill down on it:
In traditional AI debugging workflows, the AI would only see what you paste into the chat. With MCP, VS Code acts as a client that talks directly to the BetterBugs server. When you provide a report link, the AI uses specific tools to "pull" the data it needs. Simply put, the AI gets the exact console logs, network requests, and system metadata without you having to format or clean up the text.
BetterBugs gives VS Code a set of "tools" to use, such as getBugLogs (AI can call this tool from BetterBugs to retrieve the exact network responses and errors. It can see if an API failed because of a 401 (Unauthorized) versus a 500 (Server Error) without you telling it and getScreenshot (AI can analyze the visual state of the app to find UI bugs or CSS overlaps). There are 7 tools in total that BetterBugs MCP currently exposes to MCP clients (in this case, VS Code). Here’s a list of these tools:
Check out BetterBugs MCP Docs for complete information
Large log files can quickly fill up an AI's "memory" (context window), making it forget your actual code. Instead of reading everything at once, VS Code agent asks BetterBugs MCP for specific pieces of data. It might call getBugDetails first to see the error, and only call getBugLogs if it needs to see the stack trace.
BetterBugs can also capture the timing of every network request. For instance, using the getBugLogs tool, the AI agent can see the "Waterfall" chart of your API calls. For example, if a bug only happens because a specific API call took too long (a race condition), the AI can see that timing data. It can then suggest adding better loading states or "async/await" logic to handle slow connections.
AI models often guess (hallucinate) what an error might be if the description is vague. Since MCP provides the "raw" data (the actual error message from the console), the AI doesn't have to guess. This means that the code fixes VS Code AI Agent suggests are based on the real error code. If the log shows a TypeError: cannot read property “null”, the AI will focus exactly on where that variable is defined in your files.
Also Read: How to Fix Error Code Out of Memory in Chrome
Here’s an overview of the the steps to get started with using BetterBugs MCP with VS Code for AI debugging:
STEP 1: Install BetterBugs.io Chrome Extension.
STEP 2: Create a visual bug report using extension.
STEP 3: Integrate BetterBugs MCP with VS Code with quick config steps.
STEP 4: Enter prompt + BetterBugs bug report link in VS Code agent mode for your debugging sessions.
Okay! Here you go.
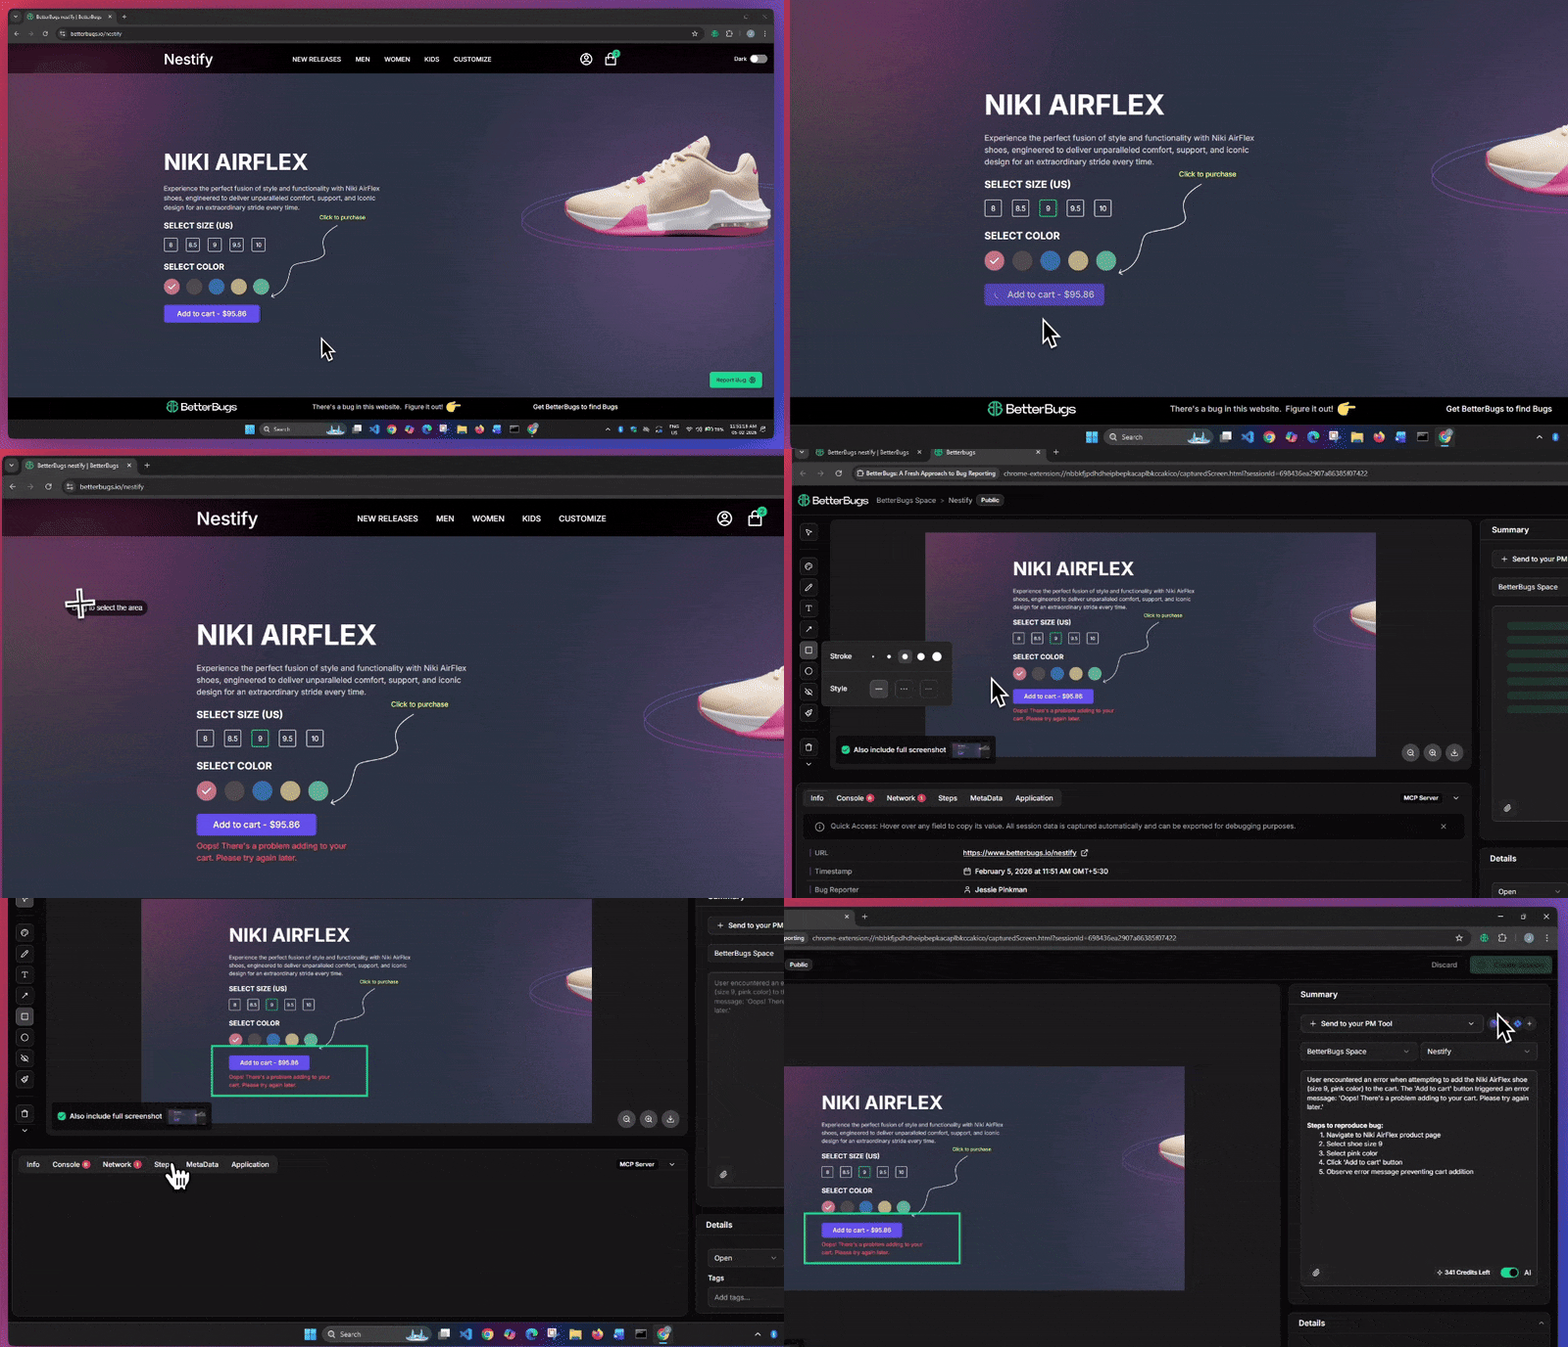
Steps to Create BetterBugs Report
Okay! Your report is ready. Keep the report link handy. We’d need the link later to share with VS Code AI Agent while debugging.
Here’s how to integrate BetterBugs MCP with VS Code:
{
  "servers": {
    "BetterBugs": {
      "url": "https://mcp.betterbugs.io/mcp",
      "type": "http"
    }
  },
  "inputs": []
}
Once the authentication is complete, this is how you should see the mcp.json file with the MCP server in running state:

BetterBugs MCP Installed on VS Code
While debugging, BetterBugs MCP exposes 7 tools (or functions that equips VS Code Ai agent with the debugging details via BetterBugs report link) to use for VS Code. When you share the BetterBugs report link with VS Code, these details (as tools) would be exposed to VS Code through BetterBugs MCP. And this would enable it to get the complete context and details to debug the issue.
Finally, here’s how to use BetterBugs report link through MCP for AI Debugging in VS Code:
PREREQUISITE: Make sure you have the BetterBugs report link handy.
1 - Open your app folder in VS Code.
2 - Open Agent Mode Chat interface from the top.
3 - Enter your prompt along with the BetterBugs report link and hit Return.

Prompt + BetterBugs Report Link in VS Code Agent Mode Chat Interface
Here’s the prompt that you can use:
“Hey AI, help me debug this issue: https://app.betterbugs.io/session/6982d6cec0219e6e8884dd27”
4 - The AI agent will then prompt you to run BetterBugs MCP (for tool calling) for debugging. Click “Allow” and “Always Allow Tools from betterbugs-mcp-server”. Or, if you want to allow the tools to run selectively, you can do that as well.

Allow VS Code to Run BetterBugs tools via MCP connection
5 - The AI Agent then runs the necessary tools from BetterBugs to get the complete context, analyzes issue screenshots, and logs to help debug and fix the issue:

BetterBugs MCP Tools used by VS Code’s AI Agent for getting complete context and issue details
6. You can then validate the key findings, root cause, and possible solutions of the issue to implement in your code.

Key Findings, Root Cause, and Possible Solution to Fix the Issue by VS Code AI agent using BetterBugs MCP
Nishil is a successful serial entrepreneur. He has more than a decade of experience in the software industry. He advocates for a culture of excellence in every software product.
Meet the Author: Nishil Patel, CEO, and Co-founder of BetterBugs. With a passion for innovation and a mission to improve software quality.
We never spam.