Loading...
Loading...
Loading...
Loading...
Loading...
Loading...

About

  • BetterBugs
  • Our Story
  • Blog
  • Glossary
  • Docs
  • Code of Conduct

Legal

  • Terms & Conditions
  • Privacy Policy
  • Cancellations & Refunds

Features

  • Record Screens
  • Create Markups
  • Developer Logs
  • Rewind
  • Collaborate with Team
  • Integrate with Project Tools
  • AI Assistant

Integrations

  • Slack
  • Jira
  • Linear
  • ClickUp
  • Asana
  • GitHub
  • MS Teams
  • Trello
  • Sentry
  • Azure Boards

Use Cases

  • QA Engineers
  • Developers
  • Managers
  • Support Teams
  • Founders
Logo

© 2026, All Rights Reserved

Nothing here!
Show us some love 💖. Try BetterBugs today if you haven’t already. A quick feedback and a rating on our Chrome web store page would be awesome!

Share your experience with the founderhere!

Don’t wait! Start reporting now.

Logo
  • Products

  • Solutions

  • Integrations

  • Resources

  • Pricing

  • BB for Support

  • MCPNew

Login
Logo

How to Download Console Logs in Chrome for Bug Reporting [2026]

Nishil Patel

Nishil Patel

Dec 12, 2025

4 min read

Last Updated May 21, 2026
Last Updated May 21, 2026

Share

How to Download Console Logs in Chrome for Bug Reporting [2026]

Check out the practical steps to capture and download console logs from Chrome devtools using the manual method. We’ve also included steps to capture logs automatically using BetterBugs.io bug reporting tool.

Table of Contents

1.

Introduction

2.

How to download console logs from Chrome

3.

How console logs can be useful for debugging purposes

4.

How to download console logs from Chrome devtools: Easiest method with one-click using BetterBugs.io

5.

How to download console logs from Chrome devtools: Manual Method

6.

FAQs

Introduction

As a developer, logs are often the first thing you check when something breaks in your app. But getting them? That’s where things get messy. Your quality assurance (QA) reports an error, you ask for logs, and you get a reply, “Okay! But it will take some time”. Sounds familiar?  

Even when you’re debugging yourself, capturing logs manually through DevTools while juggling multiple issues often feels clumsy and frustrating. Extracting them without losing your mind feels like a challenge — especially with those tight deadlines and piling backlogs. Sure, you can do it manually. However, there are smarter ways to capture those. 

In this article, we’ve included practical steps to download Chrome console logs from devtools using manual method plus automatic method using BetterBugs.io FREE Chrome extension.

Also Read: Top 18 Chrome Extensions for Web Developers

How to download console logs in Chrome

To get the devtool logs, you can use:

  • Traditional way—> Manual method to get logs from ChromeDevTools
  • Smarter way  —> Auto-capturing using BetterBugs.io which enables you to auto-capture console logs  in one-click and bundles it as a fully-fledged bug report

How console logs can be useful for debugging purposes

Here’re some ways Chrome devtool logs can help:

  • Track errors for debugging —> When your code throws an error, the console captures it with a stack trace showing the exact file, function, and line number where things went wrong. Instead of hunting through hundreds of lines of code, you can get pinpointed locations.
  • Understand user actions —> Console logs often include custom messages developers add to track when specific functions execute. This creates a timeline of what the user did before the issue occurred; perfect for getting clear context of issue repro steps.
  • Network requests and activity —> Browser console also displays failed API calls, timeout errors, and CORS issues that don't show up anywhere else. If your frontend can't communicate with the backend, the console can tell you why.
  • Performance insights —> Timing logs in the logs can also help identify performance issues or bottlenecks. If a page takes 10 seconds to load, console logs reveal whether the delay is in JavaScript execution, network requests, or rendering.
  • Local session context —> When combined with bug reporting tools, such as BetterBugs.io that also packs in the visual proof, console logs can be paired with browser version, operating system, device type, and application state so developers can better understand the conditions under which the bug occurred.

Also Read: Bug Reporting vs Bug Tracking vs Issue Tracking: What’s the Difference?

How to download console logs from Chrome devtools: Easiest method with one-click using BetterBugs.io

What is BetterBugs.io 

BetterBugs.io is a visual bug reporting tool that you can download as a FREE Chrome extension. It enables you to create context-rich and technical bug reports in one-click. It’s perfect for auto-capturing logs and debugging details from your Chrome devtool console. 

With every BetterBugs.io report, you can get:
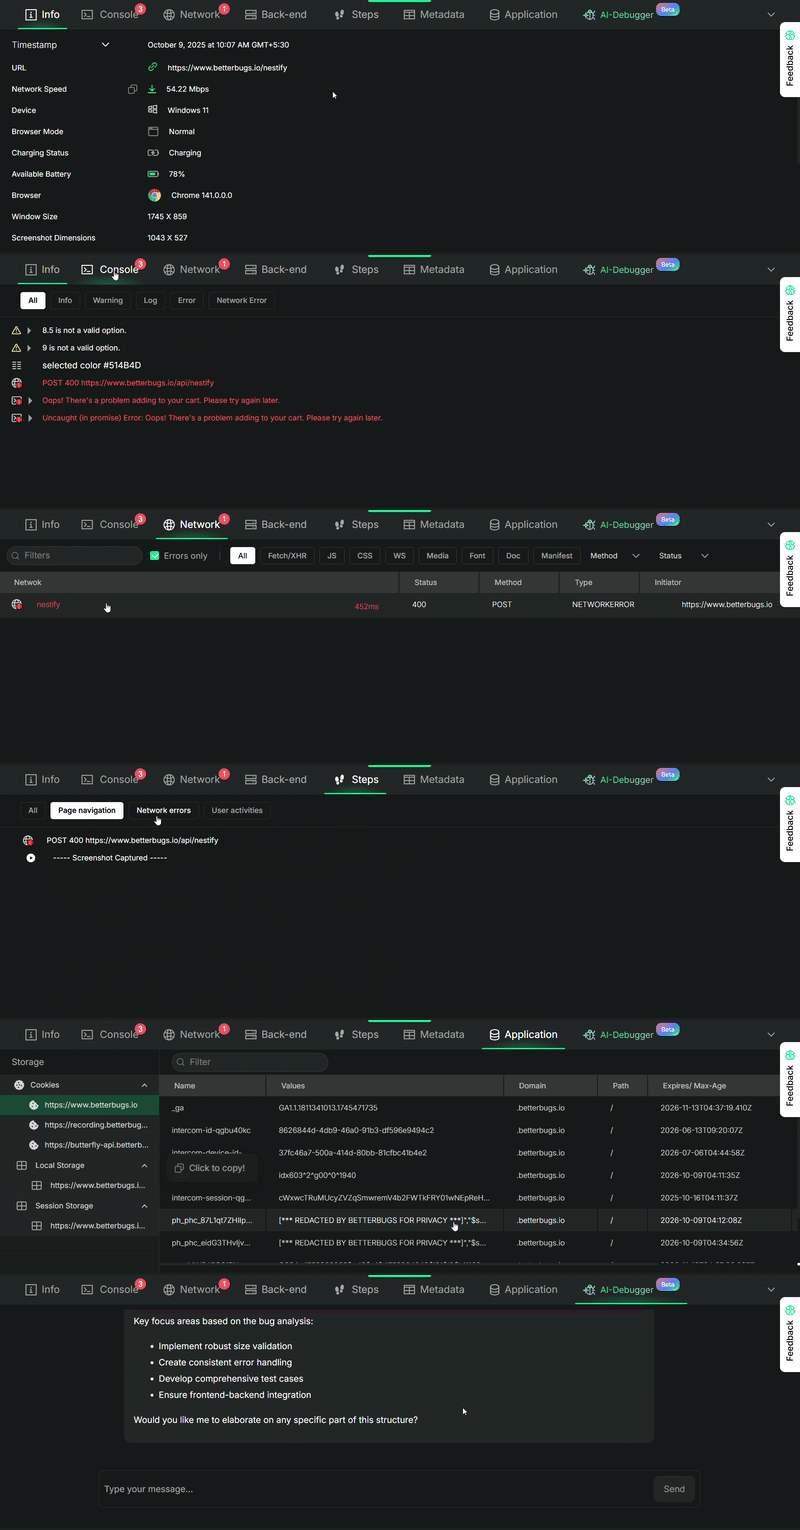
Devtools info that comes auto-bundled with every bug report

Devtools info that comes auto-bundled with every bug report

  • Info (Env and device info)
  • Console (logs, warnings, errors, and others)
  • Network requests 
  • Steps (Page navigation steps)
  • Metadata (custom)
  • Back-end (Sentry integration required for event logs)
  • Application (local/session storage info + cookies)
  • AI Debugger (chat-style AI-powered debugger for RCA, possible solution, and others)

How it works

All you need is to take a screenshot or a screen recording of the bug using BetterBugs.io to create a bug report. The devtools details for it gets auto-captured and attached instantly to the report. 

You can share the report instantly to others (using the report link) or your preferred project management tools, such as Jira, GitHub, Linear, or similar others — right from your browser. You do not have to copy-paste or download the logs and other technical details manually for sharing. BetterBugs.io does all the evidence gathering for you. 

Steps to download console logs from Chrome devtools within minutes

To get started:

  1. Download BetterBugs FREE Chrome extension. 
  2. Open extension and signup using your email, Google account, or GitHub account. This enables you to house all your bug reports in a central hub. 
  3. Pin the extension to your browser for quick access.

Here’s how to create a bug report with auto-attached console logs, network requests, and other devtool details:
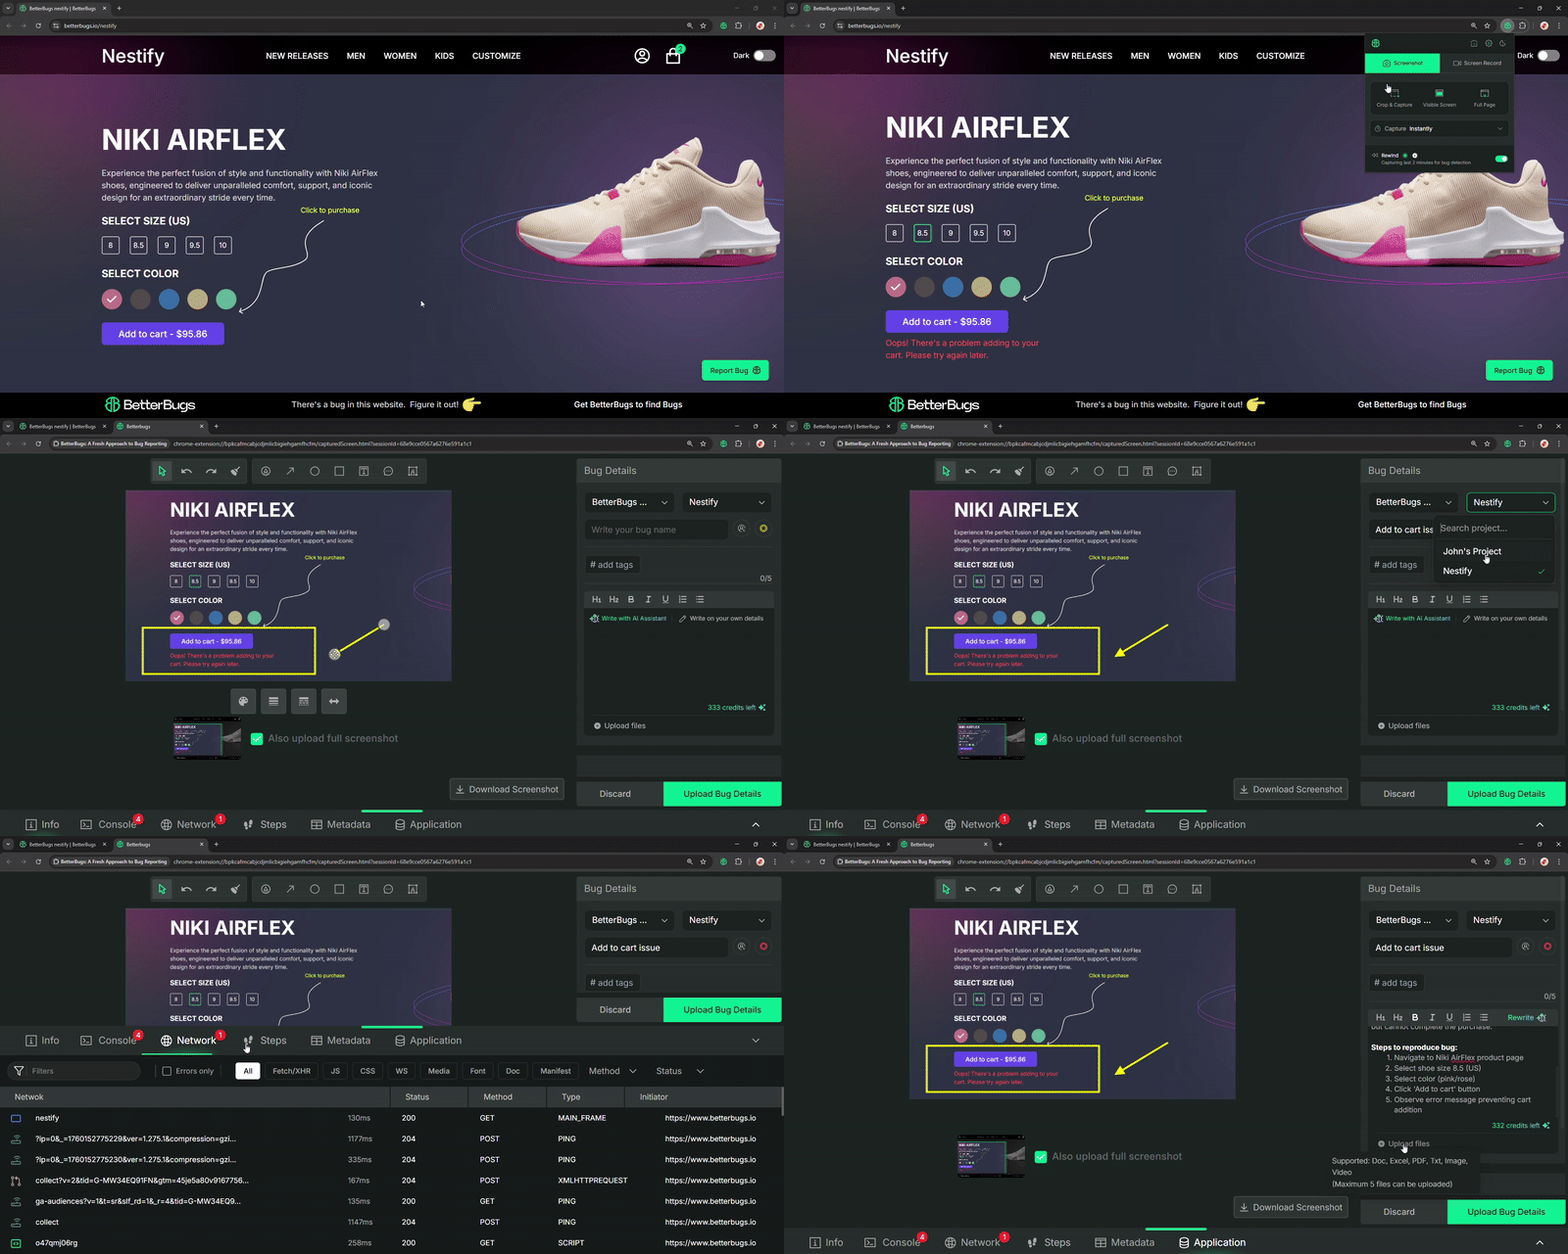
Steps to create actionable bug report with BetterBugs.io

Steps to create actionable bug report with BetterBugs.io  

  1. Open a webpage on Chrome that you’re facing issues with.
  2. Open BetterBugs.io extension and capture using screenshot or screen recording option.
  3. Select a BetterBugs Workspace and Project (this is where your report would save)
  4. Add a title and describe it manually or using AI (Use “Write with AI Assistant” to automatically add bug summary + steps to reproduce)
  5.  Click “Upload Bug Details” and you’re good to go!

Your technical bug report is ready with the visual proof + console logs + other details. You can share it with others (using the report link) or to integrate project tools. That’s how easy it is.

Get Console Logs from Chrome Devtools in One-click

How to download console logs from Chrome devtools: Manual Method

While manual capturing is a native and the most popular way to capture console and error logs, it has some limitations: 

  • It’s time-consuming and error-prone
  • It’s easy to miss critical logs if they appear briefly
  • It doesn't capture network requests or other DevTools data until you capture them separately
  • Not practical for intermittent bugs

Here’re the steps to download console logs from Chrome manually:

Step 1: Open the Console Tab in Chrome Devtools

Operating System ShortcutAlternative
Windows/ LinuxCtrl + SHift + JCtrl + Shift + I to open Devtools. Then go to the Console tab.
MacOSCommand + Option + JCommand + Option + I to open Devtools, then open Console tab.

Step 2: Reproduce the issue

  • Perform the actions on your webpage that triggers the error or issue. 
  • Check the console. It should auto-populate with messages, warnings, and errors.

Step 3: Select and copy console output

Once you've captured the relevant logs: 

  • Right-click (or Control-click on Mac) in the console area
  • Select Save as... (if available in your Chrome version) or manually select all visible logs

Alternatively, to copy visible logs manually:

  • Use Ctrl + A (Windows/Linux) or Command + A ( Mac) to select all console content
  • Press Ctrl + C (Windows/Linux) or Command + A (Mac) to copy the selected text

Step 4: Paste output as text

Open your text editor or app, paste the console logs using Ctrl + V (Windows/Linux) or Command + V (Mac).

Step 5: Save file

Give your file a descriptive name (example: console-logs-login-error-12-12-2025.txt) and save it to your system.

NOTE: Some developers prefer exporting logs as JSON for better structure. In Chrome DevTools, you can use the Settings (gear icon) → Experiments tab to enable additional export features for more advanced formatting.

Okay! You now have a permanent record of the console output.

Report and Resolve Bugs 10X Faster

FAQs

Why are Chrome console logs important for bug reporting?
How do I manually save console logs from Chrome DevTools to a file?
Do console logs include network requests and performance data?

The Console surface shows errors and messages, and it can display failed network requests and related error messages, but full request/response details live in the Network panel, not the Console itself. For performance and deeper network analysis, you can combine console logs with data from the Network and Performance panels in DevTools.​

How does BetterBugs.io help with console-log capture compared to the manual method?
Can I export console logs as JSON instead of plain text?
Written by
Nishil Patel

Nishil Patel | CEO & Founder

Follow

Nishil is a successful serial entrepreneur. He has more than a decade of experience in the software industry. He advocates for a culture of excellence in every software product.

Subscribe to our updates

Meet the Author: Nishil Patel, CEO, and Co-founder of BetterBugs. With a passion for innovation and a mission to improve software quality.

We never spam.