
Share your experience with the founderhere!

Nishil Patel
Apr 24, 2026
7 min read
Last Updated Apr 24, 2026
In this article, we’ve covered the top seven debugging challenges while debugging distributed systems in 2026. We’ve also included the practical solutions for it with examples.
1.
Introduction
2.
The Financial and Operational Costs of Distributed Systems: What Does the Data Say?
3.
What Are the Debugging Challenges in Distributed Systems: With Practical Solutions
4.
FAQs
When debugging monoliths, the flow might seem somewhat straightforward. Almost like just another Tuesday. Sure, you can open your debugger, read the stack traces, find the line of code, and fix the issue.
However, debugging a distributed system with 20 services interconnected over the network? That’s a whole another story. With a distributed architecture, when error occurs, you might spend three days looking at dashboards, grep through GBs of logs across five different services, and realize the problem only triggers when the inventory database runs a backup at the exact moment a user clicks the checkout button.
Simply put, debugging distributed systems requires a completely different approach. In these, you are no longer debugging code; you need to debug systems. In this article, we’ve covered the debugging challenges you’d come across while debugging distributed systems. Plus, we’ve included practical solutions for them with examples.
Also Read: Why Debugging Takes So Long?
Before we drill down to the core topic, let’s look at some numbers.
So, why the reversal?
Well, debugging time typically increases several folds when teams move to microservices as per these reports. Plus, the shift from in-memory function calls to network calls adds an additional layer of friction. An in-memory call may take nanoseconds. A network call between services takes milliseconds, a difference of several orders of magnitude in latency overhead.
Simply put, downtime of any sort in distributed systems costs way more to fix than traditional monoliths or consolidated systems. On top of it, distributed systems can make downtime harder to fix, especially if you lack the right tools.
Also Read: What’s the Average Cost of a Software Bug?
Here’s a list you can borrow:
Let’s briefly cover each one with practical solutions.
In a unified app, the stack trace works as one of your best resources and sources of truth to pinpoint errors and fix them right away. In a distributed system, the stack trace dies at the service boundary.
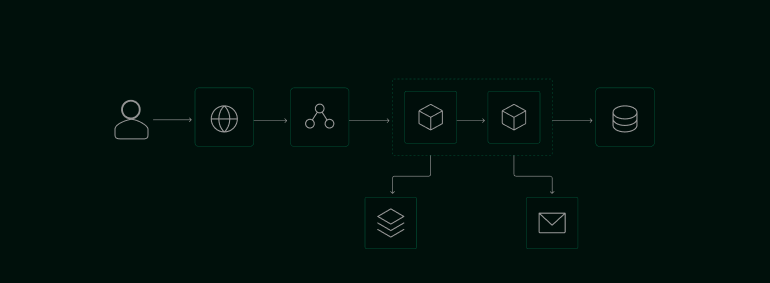
Let’s say a user reports a failed checkout in your e-commerce app. Here’s the typical flow:
The API gateway logs show a generic 500 Internal Server Error, checkout service logs show a timeout, and the worker logs show a failed database insert.
To resolve this, you’d have to stitch these isolated events together manually. And this manual correlation can take numerous hours.
You can inject a correlation ID at the edge of your system. And this is how it can help:
To make this more streamlined, you use tools like OpenTelemetry to automatically instrument your frameworks and export the data to tracing backends. This tracing gives you back the call stack at the network level.
Also Read: How to Debug using AI with BetterBugs MCP and Google Antigravity?
In a monolith, you can rely on timestamps to understand the order of events. In a distributed system, this assumption can create massive confusion. And why is that? Well, different servers have different physical clocks. These clocks drift. Network Time Protocol (NTP) keeps them synchronized, but NTP only guarantees accuracy within a few milliseconds.
In a high-throughput system, a service may execute hundreds of operations in a single millisecond. Clock drift means a log entry in one of the services (Service B) often appears to happen before the event in another service (Service A) that actually triggers it. When you cannot trust timestamps, you just cannot rely on the order of logs as well. This makes debugging race conditions nearly impossible.
To solve this, it's best to work with logical time rather than physical time itself. For this, you can use Lamport timestamps or vector clocks.
A Lamport timestamp functions as a simple counter. Every time a node performs an action, it increments its counter. When it sends a message, it includes the counter. The receiving node updates its own counter to be greater than both its current value and the received value. This ensures causality. For instance, if Event X causes Event Y, Event X always holds a lower logical timestamp than Event Y, regardless of what the physical system clocks say.
Also Read: What are the Most Common Challenges in Debugging Today?
A function call either succeeds or crashes the process in a monolith. Conversely, in a distributed architecture, the services communicate over a network. And the network can introduce partial failures, making it extremely hard to pinpoint the exact issue origin.
Let’s say your app makes an HTTP POST request to a billing service and the request times out. This is what the flow may look like:
Now, when the user retries the request in the second scenario, the app charges the user twice. Debugging this requires you to track down network-level metrics alongside app logs. It becomes crucial to determine if the failure originates from a TCP drop, a DNS resolution failure, or an application-layer timeout.
Idempotency can work pretty well to handle such scenarios. To break it down, an idempotent operation yields the same result no matter how many times you run it.
An idempotency key is generated on the client side and sends it with the request. The receiving service checks if it already processes that key. If a request times out, QA engineers can safely hit the retry button. And this enables you to debug the network latency without corrupting the database state.
NOTE: This pattern only works if the backend stores the idempotency key and checks it before performing non‑idempotent operations (e.g., charging a card).
Distributed systems may also fail in complex ways. For instance, a minor issue in a non-critical system easily takes down your entire app.
Let’s say your e-commerce store’s recommendation engine slows down. It usually responds in 20 milliseconds, but a bad database query pushes the response time to 5 seconds. Here’s a quick breakdown of the possible chain of events:
The monitoring system might alert you that the frontend service is down. However, the CPU and memory of the frontend service looks completely normal as per it. To solve this, you might restart the frontend pods. The system recovers for two minutes. However, it crashes again.
As a result, you might spend hours debugging the frontend. But, the bug actually lives in the database query of the recommendation engine.
You can prevent this using circuit breakers and bulkheads.
Also Read: How to Use BetterBugs MCP and VS Code for AI Debugging?
When you have dozens of services running all at once in a distributed system setup, they generate massive amounts of log data. To quantify this, if every service logs at the standard level, a single user session may generate hundreds of log lines or even more.
If you use basic text logs, pinpointing the error origin may feel like searching for a needle in a haystack. And you just cannot execute search commands across thirty different servers efficiently.
You can solve this by standardizing structured logging and so every service outputs logs in JSON format. This means that log no longer exists as a string of text; it can be an object with strict key-value pairs.
So, instead of logging a sentence like "User 12345 failed to purchase item 987", you can get structured logs as a JSON object like below:
{
  "trace_id": "c3a4b5-e1f2-11ec-9d64-0242ac120002",
  "user_id": "12345",
  "item_id": "987",
  "action": "purchase",
  "status": "error",
  "timestamp": "2026-04-24T09:08:43Z"
}
Then, you’d send all JSON logs to a centralized log aggregator. And now, you don’t need to scan text. Instead, you can write precise database queries.
For instance, you can search for user_id: 12345 AND status: error. Structured logging turns your text output into a queryable dataset. And this drastically reduces the time you spend finding the exact point of failure.
A "Heisenbug" refers to a software bug that seems to disappear or alter its behavior when you try to study it. And distributed systems act as factories for Heisenbugs.
In a typical setting, a bug might occur in production under heavy load. Now, when you try to reproduce it on your local machine by spinning up the local containers and running the exact same inputs, the issue just does not show! And why might this be happening?
Well, the local machine simply does not have the:
Simply put, the bug depends on a specific timing issue that only occurs when the network experiences congestion.
Here, you can use code-level profiling, AI Debugging, and advanced observability tools. Such solutions allow you to sample the execution of code in production continuously. This enables you to capture CPU and memory profiles of the exact functions running during the incident.
Plus, you can use shadow traffic to duplicate production requests and route them to an isolated staging environment. And in this very environment, you can safely attach debuggers and step through the code without impacting end-users.
In a monolith, you’d typically manage one set of env variables. On the flip side, a distributed system requires you to manage configuration across hundreds of containers.
Let’s say Service A requires an API key for a third-party integration. And Service B requires a connection string for a read-replica database.
Now when you deploy a new version of Service B, the deployment pipeline fails to inject the new connection string and Service B crashes on startup.
Debugging configuration drift requires you to check the live state of the containers, not just the code in the repo. And you might spend hours looking at application logic before you realize a missing environment variable causes the crash.
To mitigate this, you can:
Nishil is a successful serial entrepreneur. He has more than a decade of experience in the software industry. He advocates for a culture of excellence in every software product.
Meet the Author: Nishil Patel, CEO, and Co-founder of BetterBugs. With a passion for innovation and a mission to improve software quality.
We never spam.